

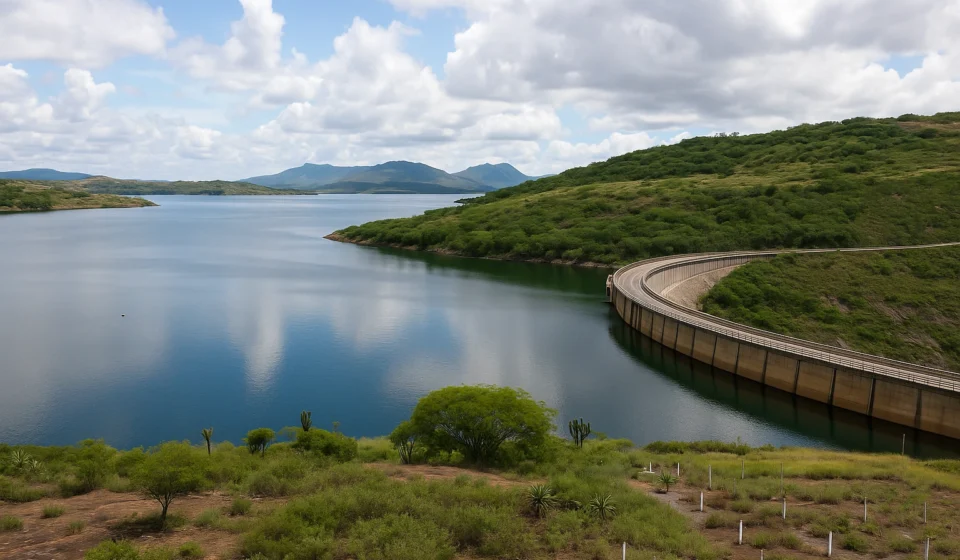
Zimbabwe’s Dams at 83.1%: Strong Storage, Uneven Across Catchment
Story By Staff Reporter
Zimbabwe’s national dam storage stands at 83.1% of capacity, according to the latest Zimbabwe National Water Authority (ZINWA) snapshot dated 28 October 2026. Across the 152 dams in the report, that equates to roughly 6,755 million cubic metres of water held against a combined capacity of about 8,129 million cubic metres. It is a comfortable headline figure heading into the final stretch of the dry season, but the detail beneath it shows a country of very different water situations.
The national picture
Storage slipped by 0.54 percentage points (weighted) over the week since 21 October 2026. A decline at this time of year is normal, as evaporation, irrigation and municipal abstraction continue while inflows are minimal. The drop is modest, roughly 44 million cubic metres by simple arithmetic on the reported capacity, and does not on its own signal stress.
The spread between dams is wide. Thirty-two dams are full or effectively full (99.9% or above), while 27 sit below 50% of capacity. About one in five dams is full, and about one in six is less than half full.
A note on method: the report excludes Lake Kariba from all totals, and the national and catchment figures reflect the official ZINWA report.
Catchment by catchment
| Catchment | Dams | Capacity (million m³) | Current (million m³) | % full |
|---|---|---|---|---|
| Runde | 31 | 4,049.9 | 3,778.0 | 93.3% |
| Save | 21 | 911.3 | 746.2 | 81.9% |
| Mzingwane | 30 | 1,078.4 | 839.9 | 77.9% |
| Sanyati | 19 | 440.5 | 319.6 | 72.6% |
| Gwayi* | 16 | 119.8 | 82.7 | 69.0% |
| Manyame* | 11 | 1,281.4 | 863.3 | 67.4% |
| Mazowe | 24 | 247.9 | 135.1 | 54.5% |
*Flagged as “partial” in the report.
Runde leads by a wide margin
The Runde catchment is the standout. At 93.3% it is the fullest of the seven, and because it holds nearly half of the national capacity, it carries a large share of the headline number. More than half of all stored water in the report sits in Runde dams. Save, at 81.9%, also falls in the healthy (green) band.
The middle of the pack
Mzingwane (77.9%) and Sanyati (72.6%) sit in the amber range. They are not in trouble, but they have less buffer than Runde and Save should the rains start late.
Areas to watch
Manyame, at 67.4%, is the most significant catchment below the national average by volume. With about 1,281 million cubic metres of capacity, it is the second largest in the report, so a shortfall there affects a large amount of water. Gwayi, at 69.0%, is much smaller in volume terms. Both are marked “partial”, which means the figures may not capture every dam in those catchments, so they should be read with some caution.
Mazowe is the lowest of all at 54.5%. Its 24 dams hold about 135 million cubic metres of a possible 248 million. It is the catchment closest to the 50% mark and the one where early-season rainfall will matter most.
What the numbers mean
A strong national position, driven by a few large reservoirs. Because Runde is so large, the 83.1% average can mask weaker conditions elsewhere. Users in Mazowe, Manyame and Gwayi are in a different position from those in Runde.
The seasonal squeeze is just beginning. Late October is typically when storage is at its lowest ahead of the rains, and small weekly declines compound. The weekly trend will be more informative than any single reading.
Data caveats matter. Kariba is excluded, two catchments are partial, and the weekly change is a weighted figure. Anyone using the data for planning should check the underlying ZINWA report for specific dams.
Outlook
With storage above 80% nationally, Zimbabwe enters the new rainy season in a stronger position than in recent drought years. The priority for water managers and users will be the catchments with thinner reserves, especially Mazowe and Manyame, and ensuring that conservation measures are applied where levels are lowest.
Source: ZINWA Dam Levels, Water Intelligence Platform data snapshot, 28 October 2026.